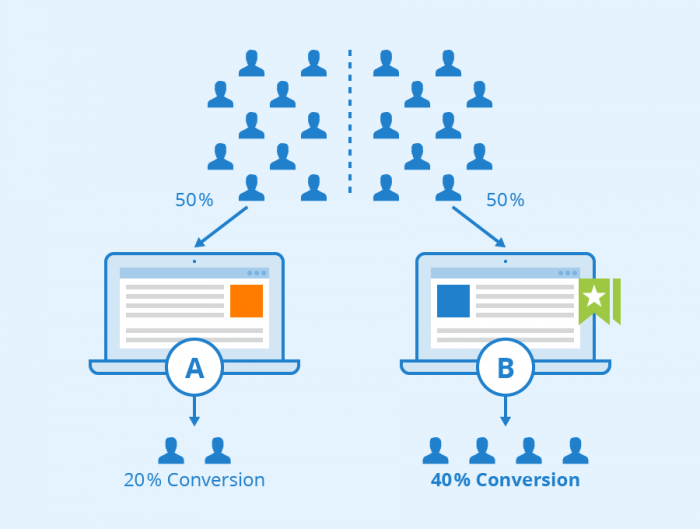
It’s been told a lot about the advantages of A/B testing, in fact, it is the only reliable way to understand, whether your change on the website is successful or not. However, before running the test, it is important to understand what we will test and what is the purpose of the test. Let’s talk about it.
- Basic principles of testing;
- Creation of a hypothesis for the test;
- Determination of rework volume for the specific page;
- Analysis of a purchase funnel;
- Examples of hypotheses.
Before passing to work with definite hypotheses for tests, learn the general (basic) principles
1. Accurately formulate the main objectives which the user should reach
Remember that except global macroconversion (for example, purchase of goods) you have also microconversion (for example, to add goods to a wish-list, to subscribe to your mailout, to be registered on carrying out a test drive etc.).
It is wrong to concentrate only on macroconversion and not consider microconversion! All purposes should be accurately formulated.
2. When you have an accurate purpose, «divide» a way of its achievement into steps
The way should be evaluated by two key parameters:
- Length of a way. Whether the user must do too many «steps» or «actions» to achieve his purpose? Are there pages or actions which do not influence the final result?
- The example of such excess page is the page of the intermediate directory, the user gets on it and moves to a deeper level. Think about it, perhaps, it is not obligatory for user to visit this page?
Give the link which directly leads to the purpose of his visit (if it is possible, of course). - The example of an excess action – I often come across a «postal index» in the order form – well, I do not remember it, I wrote the address, let the manager find this index, if it is so necessary.
Remember that points (pages), where the way begins, can be different.
For example, from search engines, the user can get on the landing page and his way will be very short. From social nets, the user will get on the main page, and then the user will have to pass several pages of the website before he finds the necessary goods.
Think over different ways of goal achievement.
— Transparency of each step. The user should understand: what he does, why does he do it, he also should remember what was on the previous step and imagine what he will do on the following step.
Example of compliance to this idea at the multistage order of goods:

The process of execution of each specific step should be as clear as possible. It does not matter what step it is: it can be click-through (link is visible and noticeable), filling of a form (all fields are reasonable and accurately signed), clicking on the “Purchase” button (the button is contrast and appropriately signed).
3. It is necessary to have statistics on each step and each page.
If there are no such statistics, it is quite difficult to create a reasonable hypothesis (sometimes it is impossible). Usually, basic problems can be solved (only with the help of an experienced UX specialist), but you will not be able to improve trifles without the statistics.
Remember! Subjective perception is an unreliable thing, especially if you are the owner of the website, who repeatedly considered and passed all way of the order, and, naturally, who knows all steps well.
It is much more difficult to get to the bottom of the process for the first time (many users will do the order for the first time). Therefore, the clearness of each step can be evaluated only from a position of collected statistics about actions of users or on the basis of polled data of target audience that is much more difficult.
4. While tracing the actions of the user, consider not only all stages until the achievement of the goal, but also the action, that will be done after that.
You can be satisfied with purchase and simply «release the visitor», or you can try to make him the regular customer or offer him to make one more purchase.
Such results can be achieved in different ways. The banalest, but nevertheless, working methods are:
- Thanks for the purchase, you can also buy …;
- Leave a contact information and receive a discount.
When we have such information, we «narrow» the focus on the specific key pages of the website which are important to sell the goods and/or to place an order.
Let’s move from the general concept to a specific task: creating a hypothesis for the test
1. The hypothesis should be accurately formulated and concern only one specific step (page).
For example, «make improvements of all headings on all pages to increase conversion» is not the accurate formulation.
«Raise the font size of the target link in the first screen of the URL-1 page in order that the user clicked through the link of the required URL-2 page as fast as possible» is an accurate formulation.
1.1 I recommend to begin the search of problem pages with points of entry (for example, you have 10 main pages which users can enter from any source).
Log into the report of Google Analytics and analyze, which page has the highest rate of failures:

The page with the highest rate of failure (especially, if it is much higher than on other pages) probably, demands rework (certainly, quality of traffic plays a great role, but in this article, we will not consider it).
On this step, we can see pages, which «frighten off» the users, who have just gone to the website, most of all. Naturally, it is necessary to work with these pages on a first-priority basis.
1.2 Estimate the way of the user from point of website entry until he enters shopping cart for his final step of shopping.
The task of the way, as you can easily get, is to reach the purpose as fast as possible, that is why:
We cut excess steps and pages which can be omitted by the user during his visit. As a rule, these are pages which «transfer» the user further by the directory.
Let's say, the directory has hierarchy of 1, 2 and 3 levels, and it is impossible to delete level 2. Then, think whether the user can skip level number 2 and have a chance to move from level 1 to level 3?
For example, put links on the page of the first level to the third level, in order that the user did not do excess clicks:

— Figure out, at what stage the user leaves this way. Here you can get help from the card of behavior in Google Analytics:

Pay attention to the pages from which users leave the website more often.
At last stage we revealed the first pages which «frighten» the visitor. Now we revealed the list of pages which «frighten off» the visitor in the course of its movement on the website.
So, having spent a little time and having used simple reports of Google Analytics, we revealed what pages in a way of the user need rework.
We define what rework is necessary for the specific page
We have a list of pages with which we need to work in the first turn.
We should define the purpose of each page – what must the user do on it?
If it is a login page or a page of the directory with the help of which the user passes, the3 main objective, most likely, is to link the page on which he can make a purchase.
If it is a page with goods, the purpose is to click «Purchase» («Order», etc.).
We have defined the purpose of the specific page, now we look for the answer to a question “What prevents the user from achievement of the goal?”
The following tools will help with it:
- Brain. Very often it is worth formulating the purpose accurately, and it becomes already clear how to improve the page in order that the user could achieve the objectives quicker and more simply.
- The map of scrolling, a reference map and a webvizor in Yandex Metrics.
Map of scrolling:

With its help, we can quickly receive the answer to a question, whether the necessary information, that is most important for achievement of the goal, is in the «focus» of users’ attention.
Possibly, not everyone scrolls to this place. Perhaps, it is worth lifting important information higher on the page?
Map of clicks and links:

Answer the question «Whether users click the most important links on the page most often?». If the answer is “No”, probably, it is worth deleting «excess links» which distract users.
Webvizor is a «cinema» about your users
While looking through the record of user’s actions, pay attention:
- where did the cursor «tarry»;
- where did the user click not clickable elements;
- what link did he use instead of the target link and what actions preceded this click-through;
- at what stage did the user leave the page (possibly, some information «pushed” your visitor “away»).
Important! Webvizor is the necessary tool, but do not allow it to «eat» your time too much. Do not analyze all records in a row, analyze only those records, which contain information on the required page.
Break these records into segments:
- At first, analyze the actions of the users who made a failure on this page.
- Further, analyze visits that began on other pages, but were interrupted on the page which you analyze.
- Then analyze visits in which this page was in the middle of the way.
- Lastly, analyze visits that contain the page considered by you and ended with success.
For each group evaluate:
- where do the users «stumble»;
- where do the users lose their way;
- where do the users leave the page (after browsing what screen of the page it occurs).
Thus we revealed specific problems on specific pages. Further, we will look for the answer to the question «How must it be changed in order that it becomes more convenient, simpler, more clear to users»?
The simplest option is to put yourself in user’s shoes, but this option is the most unreliable.
If you have an opportunity, you’d better poll users, and ask about the way to change this specific block. Considering that we speak about preparation to A/B-testing, such poll is not obligatory, but it will help to save time and to carry out the test with the most correct changes.
Making a start from accurately defined problem on the specific page, we create a hypothesis on the basis of the logical conclusions or on the basis of poll of target users.
Analysis of a purchase funnel
The actions of a user in a purchase funnel should be analyzed separately. In other words, on pages after clicking the Purchase button.
The technique of work with these pages is similar in many respects.
First of all, you should reveal the weakest page. It is reached by preliminary configured purchase funnel in Google Analytics.
During setup of the purpose, you must switch on the button “Sequence of pages” through which the user should pass for the termination of the order:

After setup you will be able to see the following picture:

You will graphically see:
- on what step most of users get lost,
- where users go from ordering page.
Evaluating each page of a purchase funnel, look for answers to the following questions:
- What distracts the user?
- What actions of the user are not obligatory and can be moved away?
- What can help the user (add information, add a photo, etc.)?
First of all, of course, it is necessary to evaluate fields for filling:
- how necessary are they,
- are they signed clearly?
The next step is to evaluate what surrounds this fields:
- How necessary is the information around them? For example, color banners which take away the visitor from the ordering form. It is quite possible, that the odd banners should be deleted.
- Is the photo of the goods selected by the user are colorful and clear enough (the desired goods should be in front of the visitor's eyes in the course of filling the ordering form), etc.
Several examples of different kinds of hypotheses:
There are 3 videos on the page, which contain very important information for your buyers, but users practically do not watch them, moreover, having looked through the page, the users leave it.
Hypothesis. Video has an unattractive caption card. If you replace it with other image containing some message for users (for example, a discount icon, etc.), the quantity of clicks on the video will increase.
The most part of the first screen is occupied by the menu block. Information on purchases is below «a hot zone» of the first screen that is obviously visible on the card of a scrolling.
Hypothesis. Having reduced the menu (for example, make it not opened, but dropping out), we will lift the important information above, and the bigger number of people will learn about it (for example, about a discount or new goods) what will effect on the number of purchases.
The great percent of users passes to the page of filling the registration form, but do not register and, finally, leave the website. You can notice by the movements of the cursor in Webvizor that the user hesitates, whether he should register or not (a part of visitors have chaotic movements of a mouse on the page).
Hypothesis. Users do not trust your website and it is worth trying to increase it, for example, having placed information on guarantees (most often it is not the text, but infographics or icons), or try to attract the user by some discounts (10% discount for a purchase of a registered user).
I cannot argue, that experiments even «at random» are much better, than doing nothing.
However, I recommend to begin with the correct statement of a question and understanding what is the purpose of test and what should be tested. In such a way, the efficiency of such tests will dramatically increase because you have:
- formulated the purposes of your website and business as accurate as possible;
- revealed the pages with the big quantity of problems;
- defined what blocks of pages «confuse users» most of all.